
🎯 Introduction
Hey there, fellow developers! 👋
After diving deep into the world of modern backend architectures and learning about the Modular Monolith approach, I decided to create something that could help developers kickstart their next project with best practices baked in from day one.
This isn't just another "hello world" template – it's a production-grade, battle-tested backend starter that I built to solve real-world problems. Whether you're building a startup MVP or a large-scale application, this template has got you covered! 🚀
Note: All demo services are deployed on free-tier platforms. You might need to wait 30-60 seconds or refresh the URL when accessing them for the first time as the services wake up from sleep mode. ⏰
🤔 Why Modular Monolith?
Before we jump in, let me explain why I chose the Modular Monolith architecture over microservices or traditional monoliths:
The Best of Both Worlds 🌍
- 🏗️ Organized like microservices - Clean separation of concerns, domain-driven design
- 🚀 Deployed like a monolith - No distributed system complexity, easier debugging
- 💰 Cost-effective - Single deployment, lower infrastructure costs
- 🔄 Easy to scale - Can split into microservices later if needed
- 👥 Team-friendly - Different teams can work on different modules independently
Think of it as microservices architecture without the microservices headache!
🛠️ Technology Stack
This template is built with modern, industry-standard technologies:
Core Technologies
- Runtime: Node.js v22+ ⚡
- Language: TypeScript 🔷
- Framework: Express.js 🚂
- Database: PostgreSQL 16 🐘
- ORM: Prisma 💎
Security & Validation
- Helmet - Security headers
- CORS - Cross-origin resource sharing
- Zod - Type-safe schema validation
- Rate Limiting - DDoS protection
- JWT - Authentication tokens
Observability Stack 📊
- Prometheus - Metrics collection
- Loki - Log aggregation
- Grafana - Visualization dashboards
- Winston - Application logging
Developer Experience
- Hot Reload - Nodemon + TSX
- Code Quality - ESLint + Prettier
- Git Hooks - Husky + Commitlint
- Testing - Node.js Native Test Runner
- Documentation - OpenAPI + Scalar UI
DevOps
- Docker - Containerization 🐳
- PM2 - Process management
- GitHub Actions - CI/CD ready
🏛️ Architecture Deep Dive
The Foundation: Modular Design
The architecture follows a layered, modular approach where each business domain lives in its own module:
src/
├── core/                   # Framework foundation
│   ├── BaseModule.ts       # Module lifecycle management
│   ├── BaseController.ts   # HTTP request handling
│   ├── BaseService.ts      # Business logic layer
│   ├── Context.ts          # Shared resources (DB, Events)
│   ├── errors/             # Custom error types
│   ├── logging/            # Winston logger setup
│   └── monitoring/         # Prometheus collectors
├── modules/                # Feature modules
│   └── Auth/               # Example: Authentication module
│       ├── AuthModule.ts
│       ├── AuthController.ts
│       ├── AuthService.ts
│       └── validators/
├── middlewares/            # Global middlewares
├── config/                 # Environment configuration
└── utils/                  # Shared utilities
Request Flow 🌊
Every request goes through multiple layers of processing:
-
Infrastructure Layer
- Helmet (Security headers)
- CORS (Origin validation)
- Rate Limiting
- Compression
-
Observability Layer
- Request ID generation
- HTTP logging (Morgan)
- Metrics collection (Prometheus)
-
Application Layer
- Module routing
- Controller (Request validation with Zod)
- Service (Business logic)
- Database (Prisma ORM)
-
Error Handling
- Centralized error handler
- Standardized JSON responses
- Stack trace logging
Context & Dependency Injection
The Context singleton provides shared resources to all modules:
class Context {
  db: PrismaClient      // Database client
  events: EventEmitter  // System events
}
Each module extends BaseModule and receives the context during initialization, making it easy to access shared resources without tight coupling.
✨ Key Features
🔒 Security First
- Helmet - Sets secure HTTP headers
- CORS - Configurable origin whitelist
- Rate Limiting - Prevents brute force attacks
- Input Validation - Zod schemas validate all inputs
- SQL Injection Protection - Prisma parameterized queries
- JWT Authentication - Secure token-based auth
📊 Observability Out of the Box
The template includes a complete monitoring stack that gives you insights into:
- System Metrics - CPU, Memory, Uptime
- API Performance - Request throughput, latency (p95), error rates
- Database Analytics - Connection pool, query performance
- Real-time Logs - Centralized log aggregation with Loki
- Custom Dashboards - Pre-configured Grafana dashboards
📚 Auto-Generated API Documentation
Interactive documentation is generated automatically from your code:
- OpenAPI/Swagger Spec - Standard API specification
- Scalar UI - Beautiful, interactive API explorer
- Basic Auth Protected - Secure your documentation in production
🐳 Full Docker Support
Three different Docker Compose configurations:
- Base Stack - Monitoring services (Grafana, Prometheus, Loki)
- Development - Hot-reload enabled
- Production - Optimized for deployment
🎯 Developer Experience
- Hot Reload - Changes reflect instantly
- Type Safety - TypeScript everywhere
- Code Quality - Automated linting and formatting
- Git Hooks - Enforce conventional commits
- Database Tools - Prisma Studio for database management
🚀 Live Demo
I've deployed the entire stack on free-tier services so you can explore everything hands-on!
⚠️ Important: These services are on free tier and may be in sleep mode. Please wait 30-60 seconds or refresh when accessing for the first time.
🖥️ Main Backend Server
Explore the backend API and documentation:
Health Check Endpoint
Check if the server is running and healthy.
URL: https://node-backend-prod-starter.onrender.com/health
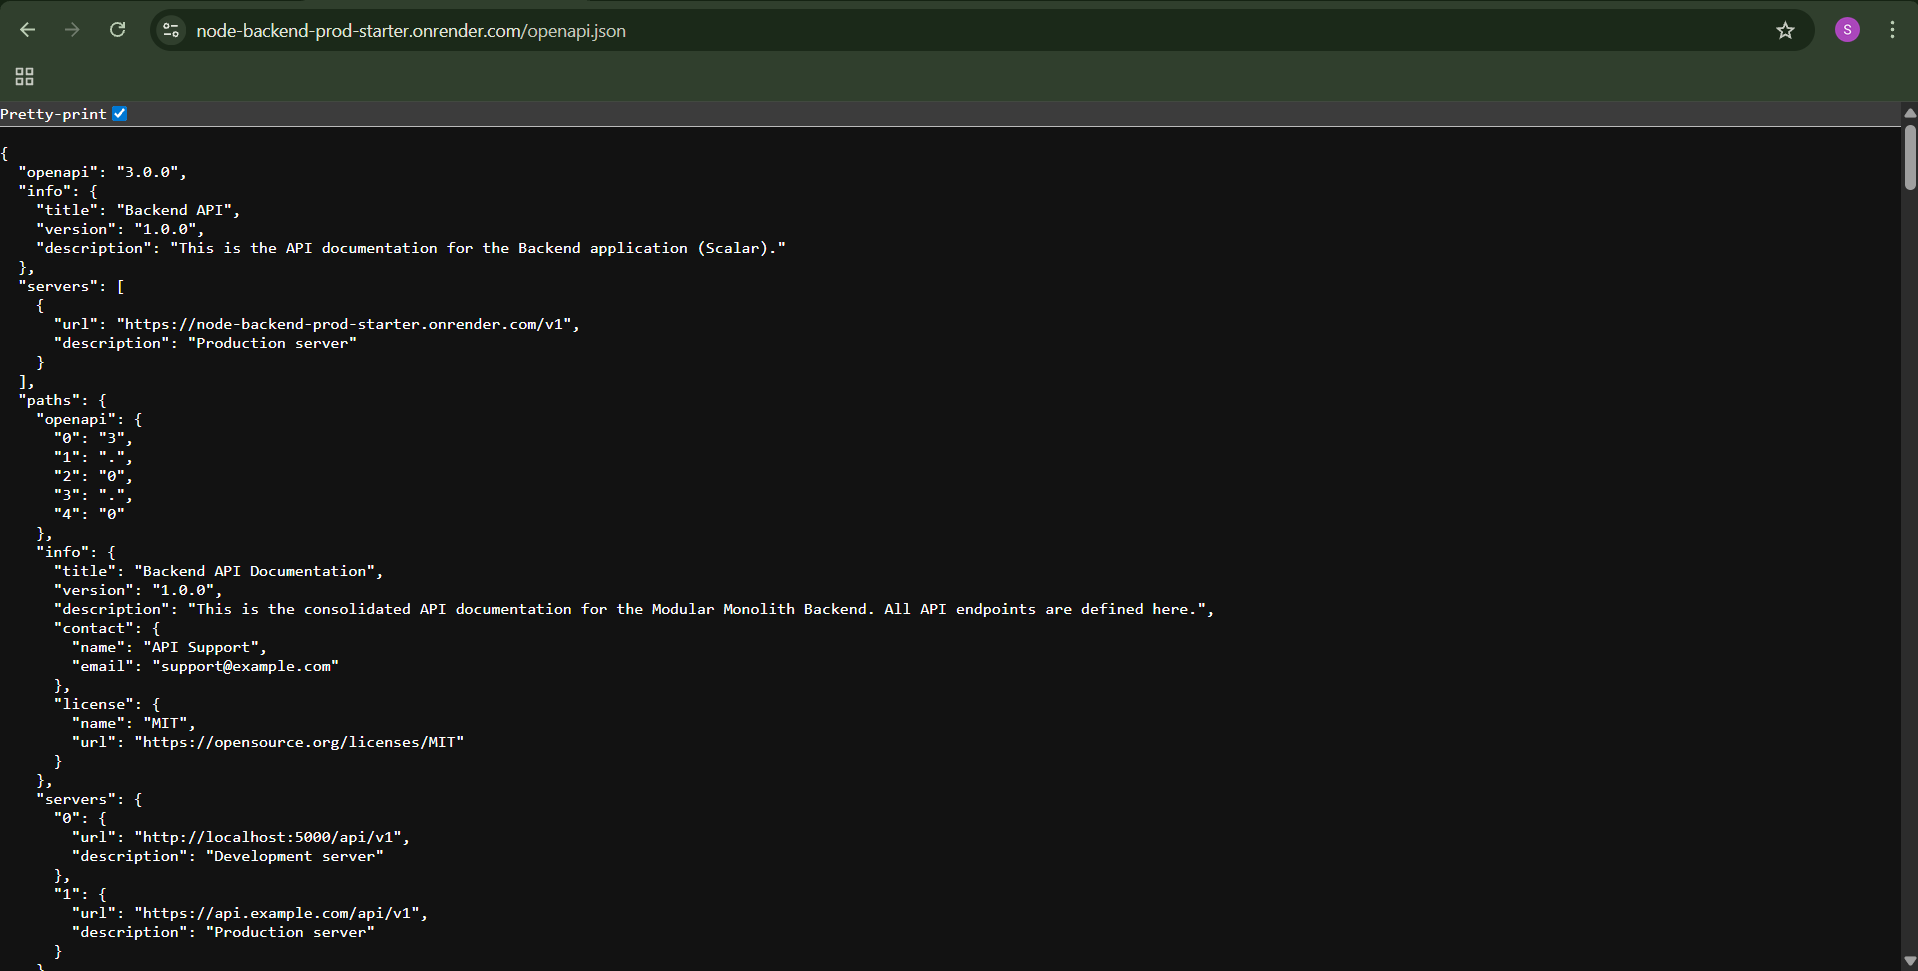
OpenAPI Specification
Access the raw OpenAPI JSON specification.
URL: https://node-backend-prod-starter.onrender.com/openapi.json
Credentials: admin / admin
📖 Scalar API Documentation
Beautiful, interactive API documentation with a modern UI.
URL: https://node-backend-prod-starter.onrender.com/reference
Credentials: admin / admin
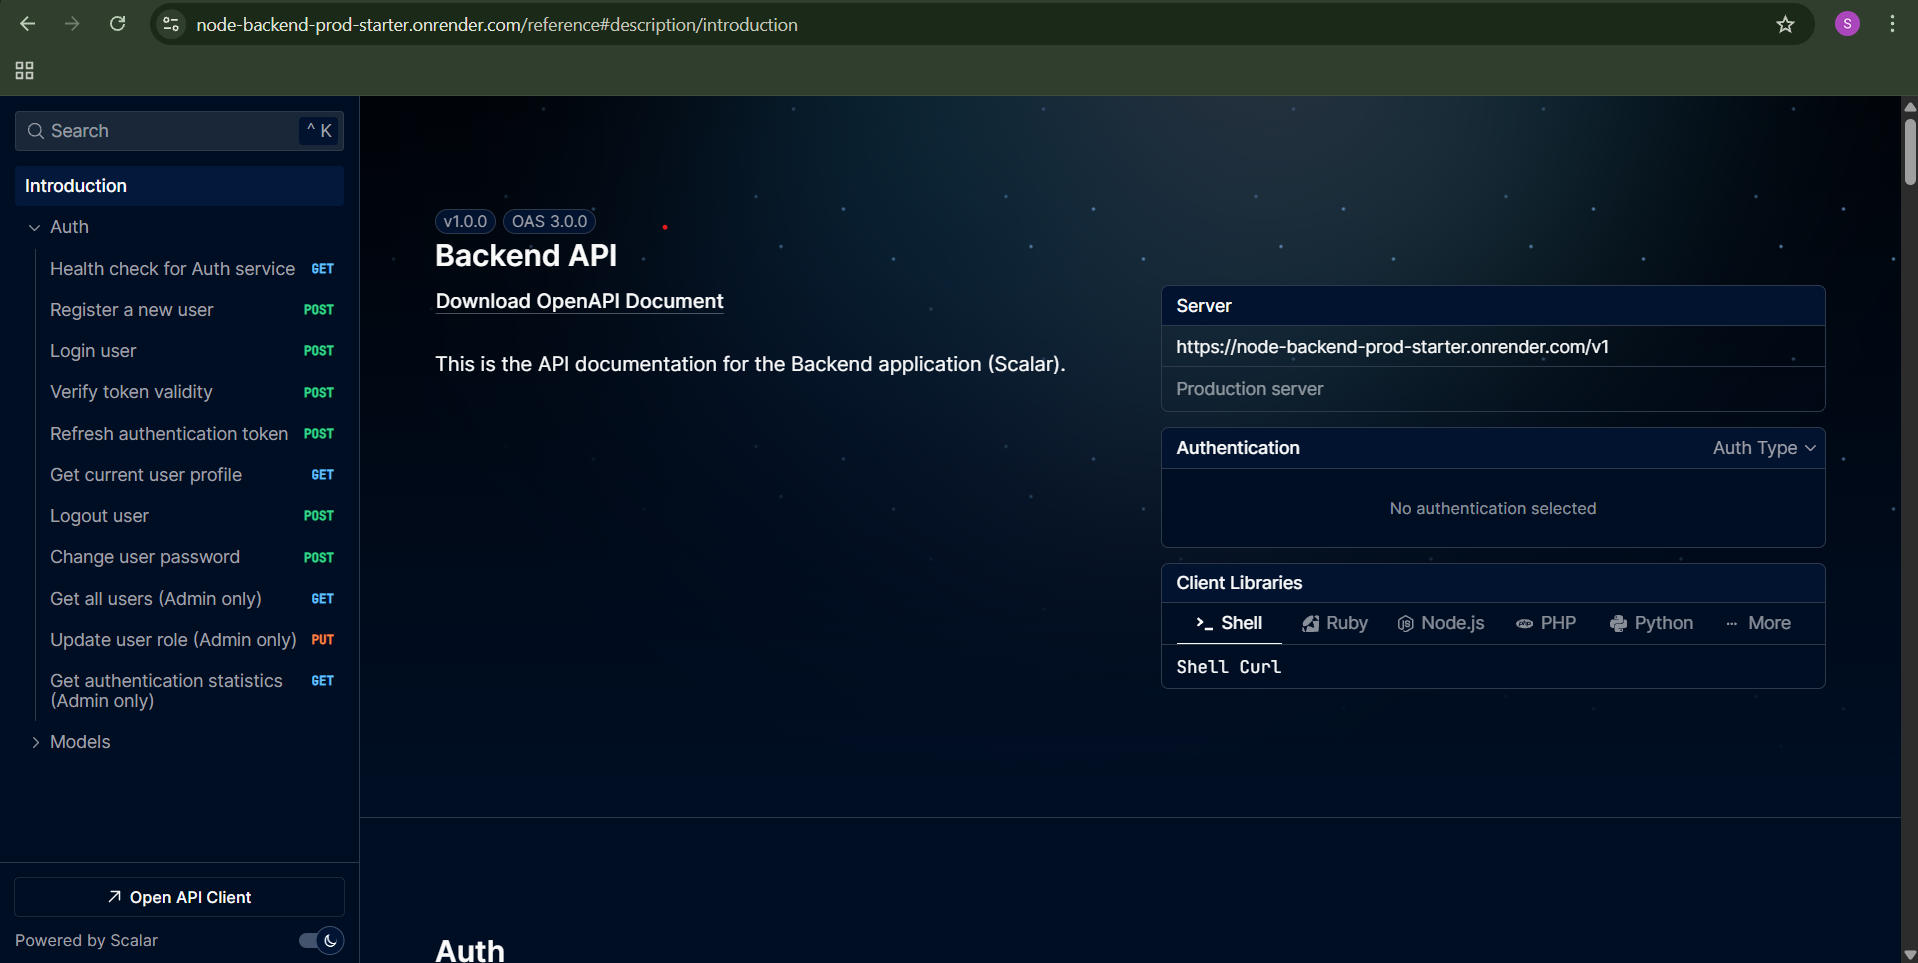
Try out API endpoints directly from the browser! Test authentication, explore request/response schemas, and see examples in multiple programming languages. ✨
📊 Monitoring & Observability Stack
Loki - Log Aggregation
Centralized logging system that collects all application logs.
URL: https://loki-production-238c.up.railway.app/
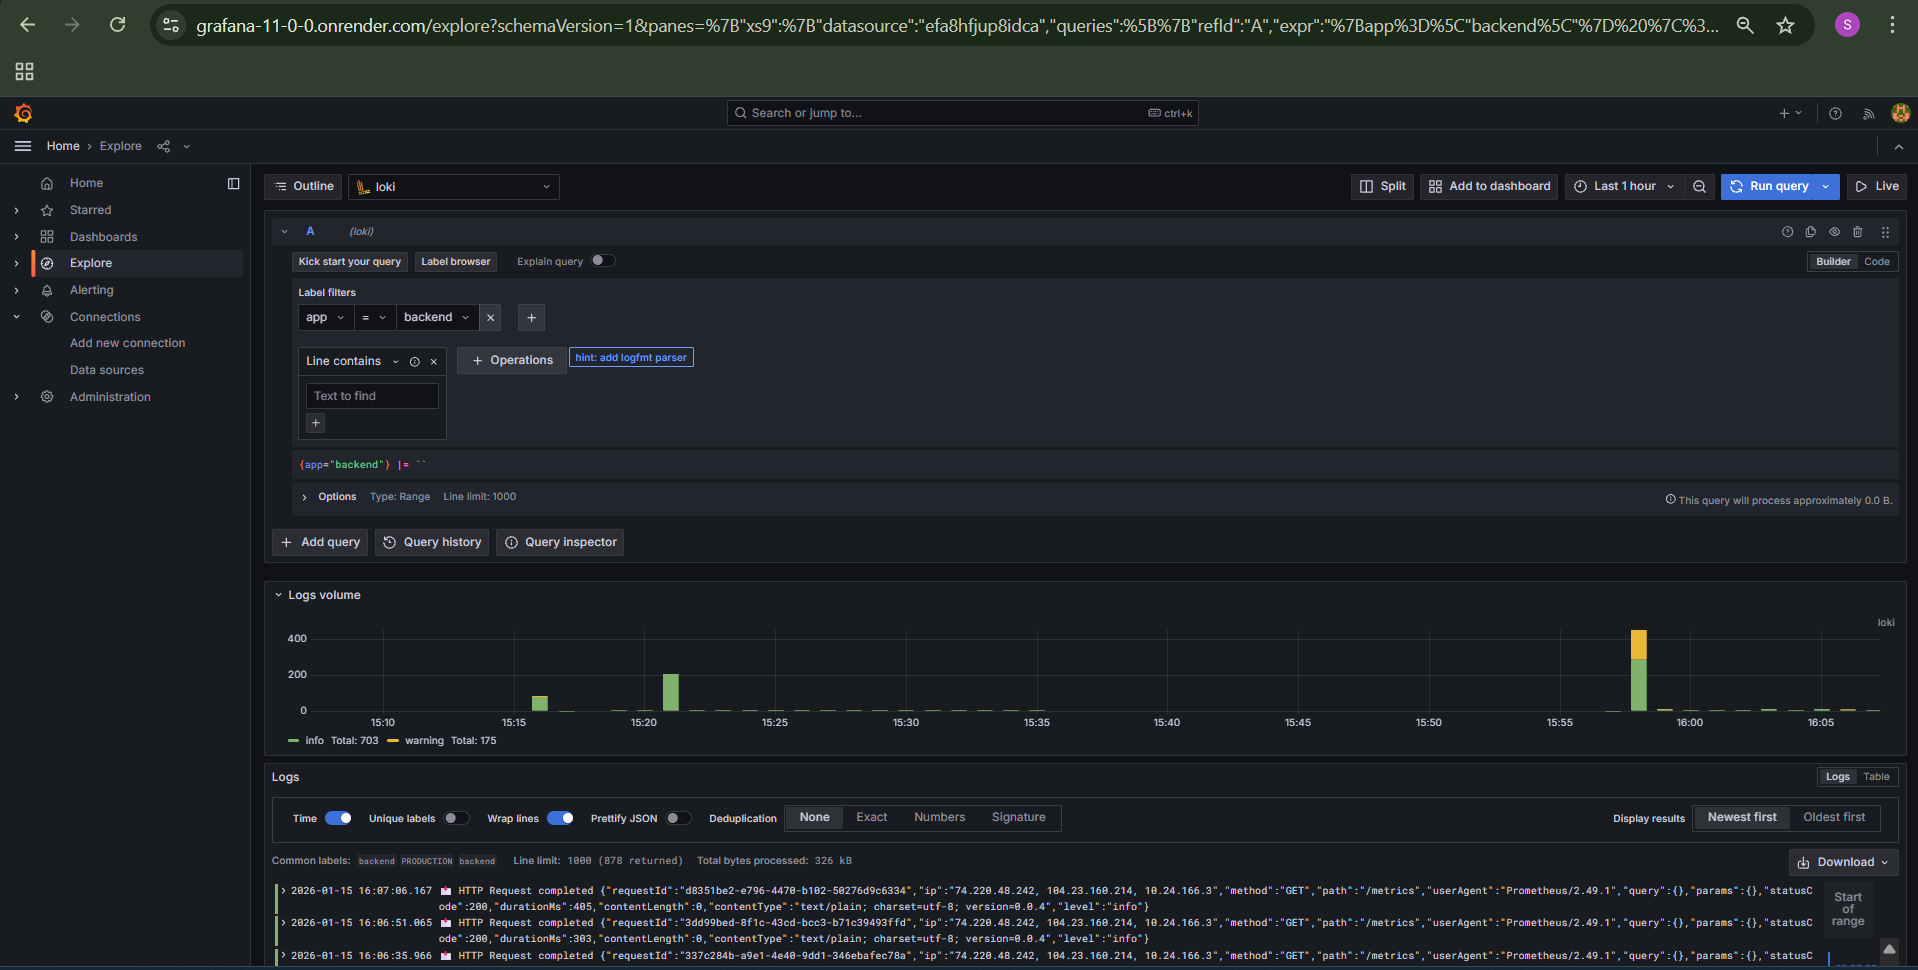
Loki provides a simple way to aggregate logs from your application. It integrates seamlessly with Grafana for log visualization.
Prometheus - Metrics Collection
Time-series database collecting real-time metrics from the application.
URL: https://docker-4a0f.onrender.com/
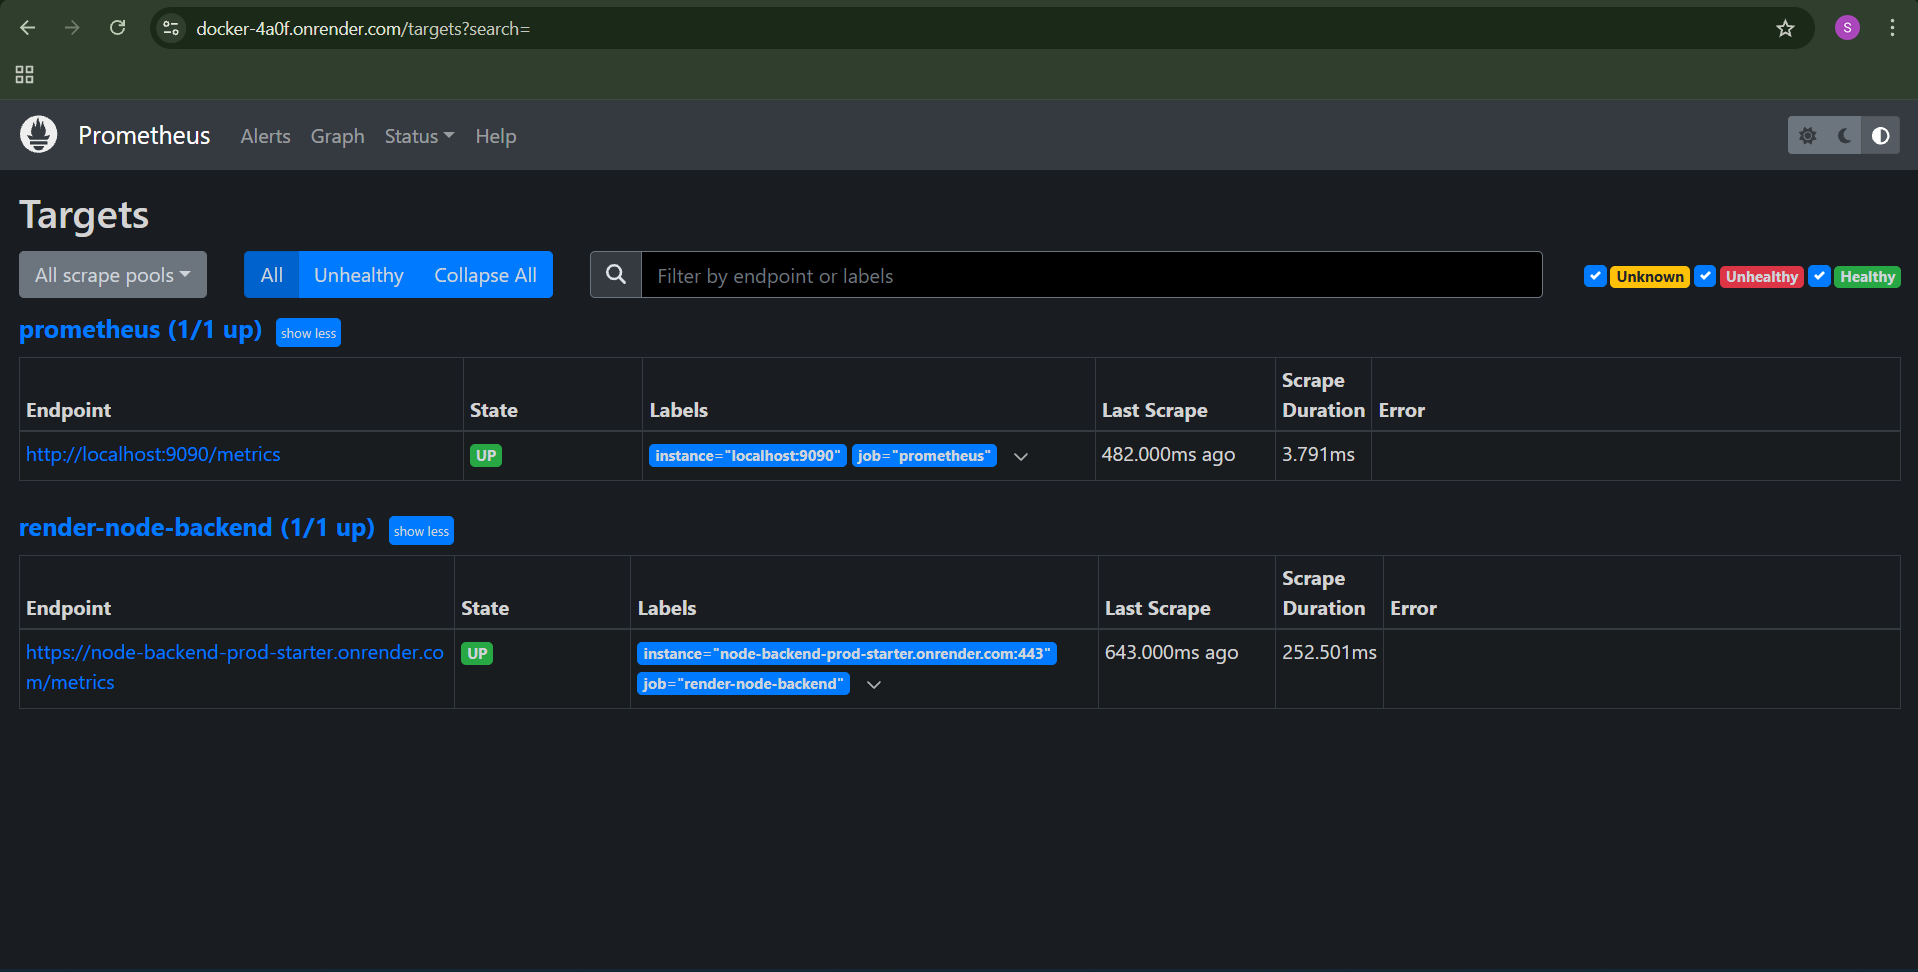
Prometheus scrapes metrics every 5 seconds, including HTTP request duration, database query performance, and system resource usage.
Grafana - Visualization & Dashboards
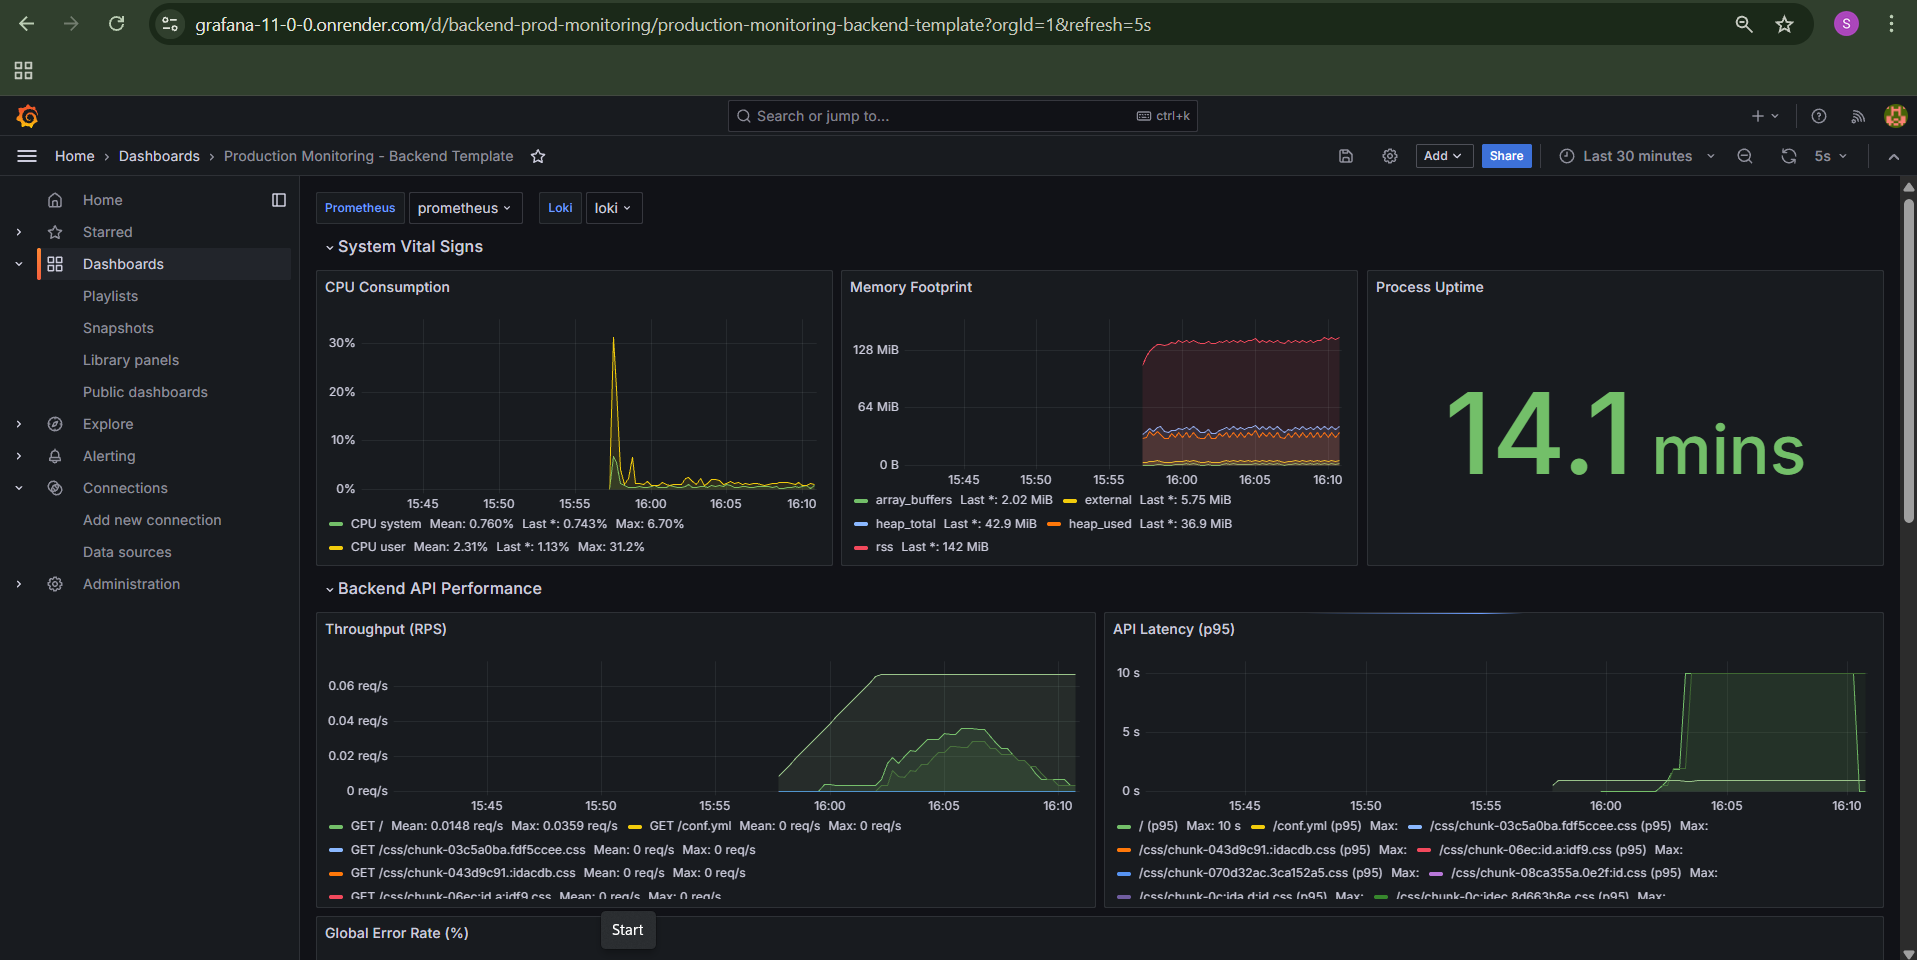
The heart of our observability stack! Beautiful dashboards showing real-time metrics.
URL: https://grafana-11-0-0.onrender.com/
Credentials: admin / admin
🎯 Setting Up Grafana (First Time Users)
Since we're using free-tier services, Grafana doesn't persist data between restarts. Here's how to set it up:
Step 1: Add Data Sources
- Click on Configuration ⚙️ > Data Sources
- Add Loki data source:
- URL:
https://loki-production-238c.up.railway.app/ - Click Save & Test
- URL:
- Add Prometheus data source:
- URL:
https://docker-4a0f.onrender.com/ - Click Save & Test
- URL:
💡 Pro Tip: Make sure both Loki and Prometheus URLs are accessible before adding them as data sources!
Step 2: Import Dashboard
- Click on Dashboards 📊 > New > Import
- Paste the dashboard JSON below
- Click Load and then Import
{
"annotations": {
"list": [
{
"builtIn": 1,
"datasource": {
"type": "grafana",
"uid": "-- Mixed --"
},
"enable": true,
"hide": true,
"iconColor": "rgba(0, 211, 255, 1)",
"name": "Annotations & Alerts",
"type": "dashboard"
}
]
},
"editable": true,
"fiscalYearStartMonth": 0,
"graphTooltip": 1,
"id": null,
"links": [],
"liveNow": false,
"panels": [
{
"collapsed": false,
"gridPos": {
"h": 1,
"w": 24,
"x": 0,
"y": 0
},
"id": 1,
"panels": [],
"title": "System Vital Signs",
"type": "row"
},
{
"datasource": {
"type": "prometheus",
"uid": "${prometheus}"
},
"fieldConfig": {
"defaults": {
"color": {
"mode": "palette-classic"
},
"custom": {
"axisBorderShow": false,
"axisCenteredZero": false,
"axisColorMode": "text",
"axisLabel": "",
"axisPlacement": "auto",
"barAlignment": 0,
"drawStyle": "line",
"fillOpacity": 10,
"gradientMode": "none",
"hideFrom": {
"legend": false,
"tooltip": false,
"viz": false
},
"insertNulls": false,
"lineInterpolation": "linear",
"lineWidth": 1,
"pointSize": 5,
"scaleDistribution": {
"type": "linear"
},
"showPoints": "auto",
"spanNulls": false,
"stacking": {
"group": "A",
"mode": "none"
},
"thresholdsStyle": {
"mode": "off"
}
},
"mappings": [],
"thresholds": {
"mode": "absolute",
"steps": [
{
"color": "green",
"value": null
},
{
"color": "red",
"value": 80
}
]
},
"unit": "percentunit"
},
"overrides": []
},
"gridPos": {
"h": 8,
"w": 8,
"x": 0,
"y": 1
},
"id": 2,
"options": {
"legend": {
"calcs": ["mean", "lastNotNull", "max"],
"displayMode": "list",
"placement": "bottom",
"showLegend": true
},
"tooltip": {
"mode": "multi",
"sort": "none"
}
},
"targets": [
{
"datasource": {
"type": "prometheus",
"uid": "${prometheus}"
},
"editorMode": "code",
"expr": "sum(app_nodejs_cpu_usage_seconds) by (type)",
"instant": false,
"legendFormat": "CPU {{type}}",
"range": true,
"refId": "A"
}
],
"title": "CPU Consumption",
"type": "timeseries"
},
{
"datasource": {
"type": "prometheus",
"uid": "${prometheus}"
},
"fieldConfig": {
"defaults": {
"color": {
"mode": "palette-classic"
},
"custom": {
"axisBorderShow": false,
"axisCenteredZero": false,
"axisColorMode": "text",
"axisLabel": "",
"axisPlacement": "auto",
"barAlignment": 0,
"drawStyle": "line",
"fillOpacity": 10,
"gradientMode": "none",
"hideFrom": {
"legend": false,
"tooltip": false,
"viz": false
},
"insertNulls": false,
"lineInterpolation": "linear",
"lineWidth": 1,
"pointSize": 5,
"scaleDistribution": {
"type": "linear"
},
"showPoints": "auto",
"spanNulls": false,
"stacking": {
"group": "A",
"mode": "none"
},
"thresholdsStyle": {
"mode": "off"
}
},
"mappings": [],
"thresholds": {
"mode": "absolute",
"steps": [
{
"color": "green",
"value": null
}
]
},
"unit": "bytes"
},
"overrides": []
},
"gridPos": {
"h": 8,
"w": 8,
"x": 8,
"y": 1
},
"id": 3,
"options": {
"legend": {
"calcs": ["lastNotNull"],
"displayMode": "list",
"placement": "bottom",
"showLegend": true
},
"tooltip": {
"mode": "multi",
"sort": "none"
}
},
"targets": [
{
"datasource": {
"type": "prometheus",
"uid": "${prometheus}"
},
"editorMode": "code",
"expr": "app_nodejs_memory_usage_bytes",
"instant": false,
"legendFormat": "{{type}}",
"range": true,
"refId": "A"
}
],
"title": "Memory Footprint",
"type": "timeseries"
},
{
"datasource": {
"type": "prometheus",
"uid": "${prometheus}"
},
"fieldConfig": {
"defaults": {
"color": {
"mode": "palette-classic"
},
"mappings": [],
"thresholds": {
"mode": "absolute",
"steps": [
{
"color": "green",
"value": null
},
{
"color": "red",
"value": 1
}
]
},
"unit": "s"
},
"overrides": []
},
"gridPos": {
"h": 8,
"w": 8,
"x": 16,
"y": 1
},
"id": 14,
"options": {
"colorMode": "value",
"graphMode": "area",
"justifyMode": "auto",
"orientation": "auto",
"reduceOptions": {
"calcs": ["lastNotNull"],
"fields": "",
"values": false
},
"textMode": "auto"
},
"targets": [
{
"datasource": {
"type": "prometheus",
"uid": "${prometheus}"
},
"editorMode": "code",
"expr": "app_process_uptime_seconds",
"instant": true,
"range": false,
"refId": "A"
}
],
"title": "Process Uptime",
"type": "stat"
},
{
"collapsed": false,
"gridPos": {
"h": 1,
"w": 24,
"x": 0,
"y": 9
},
"id": 4,
"panels": [],
"title": "Backend API Performance",
"type": "row"
},
{
"datasource": {
"type": "prometheus",
"uid": "${prometheus}"
},
"fieldConfig": {
"defaults": {
"color": {
"mode": "palette-classic"
},
"custom": {
"axisBorderShow": false,
"axisCenteredZero": false,
"axisColorMode": "text",
"axisLabel": "",
"axisPlacement": "auto",
"barAlignment": 0,
"drawStyle": "line",
"fillOpacity": 10,
"gradientMode": "none",
"hideFrom": {
"legend": false,
"tooltip": false,
"viz": false
},
"insertNulls": false,
"lineInterpolation": "linear",
"lineWidth": 1,
"pointSize": 5,
"scaleDistribution": {
"type": "linear"
},
"showPoints": "auto",
"spanNulls": false,
"stacking": {
"group": "A",
"mode": "none"
},
"thresholdsStyle": {
"mode": "off"
}
},
"mappings": [],
"thresholds": {
"mode": "absolute",
"steps": [
{
"color": "green",
"value": null
}
]
},
"unit": "reqps"
},
"overrides": []
},
"gridPos": {
"h": 8,
"w": 12,
"x": 0,
"y": 10
},
"id": 5,
"options": {
"legend": {
"calcs": ["mean", "max"],
"displayMode": "list",
"placement": "bottom",
"showLegend": true
},
"tooltip": {
"mode": "multi",
"sort": "none"
}
},
"targets": [
{
"datasource": {
"type": "prometheus",
"uid": "${prometheus}"
},
"editorMode": "code",
"expr": "sum(rate(app_http_requests_total[5m])) by (route, method)",
"instant": false,
"legendFormat": "{{method}} {{route}}",
"range": true,
"refId": "A"
}
],
"title": "Throughput (RPS)",
"type": "timeseries"
},
{
"datasource": {
"type": "prometheus",
"uid": "${prometheus}"
},
"fieldConfig": {
"defaults": {
"color": {
"mode": "palette-classic"
},
"custom": {
"axisBorderShow": false,
"axisCenteredZero": false,
"axisColorMode": "text",
"axisLabel": "",
"axisPlacement": "auto",
"barAlignment": 0,
"drawStyle": "line",
"fillOpacity": 10,
"gradientMode": "none",
"hideFrom": {
"legend": false,
"tooltip": false,
"viz": false
},
"insertNulls": false,
"lineInterpolation": "linear",
"lineWidth": 1,
"pointSize": 5,
"scaleDistribution": {
"type": "linear"
},
"showPoints": "auto",
"spanNulls": false,
"stacking": {
"group": "A",
"mode": "none"
},
"thresholdsStyle": {
"mode": "off"
}
},
"mappings": [],
"thresholds": {
"mode": "absolute",
"steps": [
{
"color": "green",
"value": null
}
]
},
"unit": "s"
},
"overrides": []
},
"gridPos": {
"h": 8,
"w": 12,
"x": 12,
"y": 10
},
"id": 6,
"options": {
"legend": {
"calcs": ["max"],
"displayMode": "list",
"placement": "bottom",
"showLegend": true
},
"tooltip": {
"mode": "multi",
"sort": "none"
}
},
"targets": [
{
"datasource": {
"type": "prometheus",
"uid": "${prometheus}"
},
"editorMode": "code",
"expr": "histogram_quantile(0.95, sum(rate(app_http_request_duration_seconds_bucket[5m])) by (le, route))",
"instant": false,
"legendFormat": "{{route}} (p95)",
"range": true,
"refId": "A"
}
],
"title": "API Latency (p95)",
"type": "timeseries"
},
{
"datasource": {
"type": "prometheus",
"uid": "${prometheus}"
},
"fieldConfig": {
"defaults": {
"color": {
"mode": "thresholds"
},
"mappings": [],
"thresholds": {
"mode": "absolute",
"steps": [
{
"color": "green",
"value": null
},
{
"color": "orange",
"value": 1
},
{
"color": "red",
"value": 5
}
]
},
"unit": "percent"
},
"overrides": []
},
"gridPos": {
"h": 6,
"w": 24,
"x": 0,
"y": 18
},
"id": 15,
"options": {
"colorMode": "value",
"graphMode": "area",
"justifyMode": "auto",
"orientation": "auto",
"reduceOptions": {
"calcs": ["lastNotNull"],
"fields": "",
"values": false
},
"textMode": "auto"
},
"targets": [
{
"datasource": {
"type": "prometheus",
"uid": "${prometheus}"
},
"editorMode": "code",
"expr": "sum(rate(app_http_errors_total[5m])) / sum(rate(app_http_requests_total[5m])) * 100",
"instant": true,
"range": false,
"refId": "A"
}
],
"title": "Global Error Rate (%)",
"type": "stat"
},
{
"collapsed": false,
"gridPos": {
"h": 1,
"w": 24,
"x": 0,
"y": 24
},
"id": 7,
"panels": [],
"title": "Application Observability & Logs",
"type": "row"
},
{
"datasource": {
"type": "loki",
"uid": "${loki}"
},
"gridPos": {
"h": 12,
"w": 24,
"x": 0,
"y": 25
},
"id": 8,
"options": {
"dedupStrategy": "none",
"enableLogDetails": true,
"prettifyLogMessage": false,
"showCommonLabels": false,
"showLabels": false,
"showTime": true,
"sortOrder": "Descending",
"wrapLogMessage": true
},
"targets": [
{
"datasource": {
"type": "loki",
"uid": "${loki}"
},
"editorMode": "code",
"expr": "{app=\"backend\"}",
"queryType": "range",
"refId": "A"
}
],
"title": "Live Application Logs",
"type": "logs"
},
{
"collapsed": false,
"gridPos": {
"h": 1,
"w": 24,
"x": 0,
"y": 37
},
"id": 9,
"panels": [],
"title": "Database Intelligence (Prisma/PG)",
"type": "row"
},
{
"datasource": {
"type": "prometheus",
"uid": "${prometheus}"
},
"fieldConfig": {
"defaults": {
"color": {
"mode": "palette-classic"
},
"custom": {
"axisBorderShow": false,
"axisCenteredZero": false,
"axisColorMode": "text",
"axisLabel": "",
"axisPlacement": "auto",
"barAlignment": 0,
"drawStyle": "line",
"fillOpacity": 10,
"gradientMode": "none",
"hideFrom": {
"legend": false,
"tooltip": false,
"viz": false
},
"insertNulls": false,
"lineInterpolation": "linear",
"lineWidth": 1,
"pointSize": 5,
"scaleDistribution": {
"type": "linear"
},
"showPoints": "auto",
"spanNulls": false,
"stacking": {
"group": "A",
"mode": "none"
},
"thresholdsStyle": {
"mode": "off"
}
},
"mappings": [],
"thresholds": {
"mode": "absolute",
"steps": [
{
"color": "green",
"value": null
}
]
}
},
"overrides": []
},
"gridPos": {
"h": 8,
"w": 12,
"x": 0,
"y": 38
},
"id": 10,
"options": {
"legend": {
"calcs": ["lastNotNull"],
"displayMode": "list",
"placement": "bottom",
"showLegend": true
},
"tooltip": {
"mode": "multi",
"sort": "none"
}
},
"targets": [
{
"datasource": {
"type": "prometheus",
"uid": "${prometheus}"
},
"editorMode": "code",
"expr": "app_database_connection_pool_size",
"instant": false,
"legendFormat": "{{state}} connections",
"range": true,
"refId": "A"
}
],
"title": "DB Connection Pool",
"type": "timeseries"
},
{
"datasource": {
"type": "prometheus",
"uid": "${prometheus}"
},
"fieldConfig": {
"defaults": {
"color": {
"mode": "palette-classic"
},
"custom": {
"axisBorderShow": false,
"axisCenteredZero": false,
"axisColorMode": "text",
"axisLabel": "",
"axisPlacement": "auto",
"barAlignment": 0,
"drawStyle": "line",
"fillOpacity": 10,
"gradientMode": "none",
"hideFrom": {
"legend": false,
"tooltip": false,
"viz": false
},
"insertNulls": false,
"lineInterpolation": "linear",
"lineWidth": 1,
"pointSize": 5,
"scaleDistribution": {
"type": "linear"
},
"showPoints": "auto",
"spanNulls": false,
"stacking": {
"group": "A",
"mode": "none"
},
"thresholdsStyle": {
"mode": "off"
}
},
"mappings": [],
"thresholds": {
"mode": "absolute",
"steps": [
{
"color": "green",
"value": null
}
]
},
"unit": "s"
},
"overrides": []
},
"gridPos": {
"h": 8,
"w": 12,
"x": 12,
"y": 38
},
"id": 11,
"options": {
"legend": {
"calcs": ["max"],
"displayMode": "list",
"placement": "bottom",
"showLegend": true
},
"tooltip": {
"mode": "multi",
"sort": "none"
}
},
"targets": [
{
"datasource": {
"type": "prometheus",
"uid": "${prometheus}"
},
"editorMode": "code",
"expr": "histogram_quantile(0.95, sum(rate(app_database_query_duration_seconds_bucket[5m])) by (le, operation))",
"instant": false,
"legendFormat": "{{operation}} (p95)",
"range": true,
"refId": "A"
}
],
"title": "DB Latency (p95)",
"type": "timeseries"
}
],
"refresh": "5s",
"schemaVersion": 39,
"tags": ["production", "backend", "slos"],
"templating": {
"list": [
{
"current": {
"selected": false,
"text": "Prometheus",
"value": "prometheus"
},
"hide": 0,
"includeAll": false,
"label": "Prometheus",
"multi": false,
"name": "prometheus",
"options": [],
"query": "prometheus",
"refresh": 1,
"regex": "",
"skipUrlSync": false,
"type": "datasource"
},
{
"current": {
"selected": false,
"text": "Loki",
"value": "loki"
},
"hide": 0,
"includeAll": false,
"label": "Loki",
"multi": false,
"name": "loki",
"options": [],
"query": "loki",
"refresh": 1,
"regex": "",
"skipUrlSync": false,
"type": "datasource"
}
]
},
"time": {
"from": "now-30m",
"to": "now"
},
"timepicker": {},
"timezone": "browser",
"title": "Production Monitoring - Backend Template",
"uid": "backend-prod-monitoring",
"version": 2,
"weekStart": ""
}What You'll See:
The dashboard includes four main sections:
-
System Vital Signs 💓
- CPU consumption by type (user/system)
- Memory footprint (heap, external, RSS)
- Process uptime
-
Backend API Performance 🚀
- Request throughput (requests per second)
- API latency at 95th percentile
- Global error rate percentage
-
Application Observability & Logs 📋
- Real-time log streaming
- Filterable by log level and message
-
Database Intelligence 🗄️
- Connection pool status
- Query latency by operation type
Dashy - Unified Dashboard
A beautiful, customizable dashboard to access all your services in one place!
URL: https://dashy-latest-7acp.onrender.com/
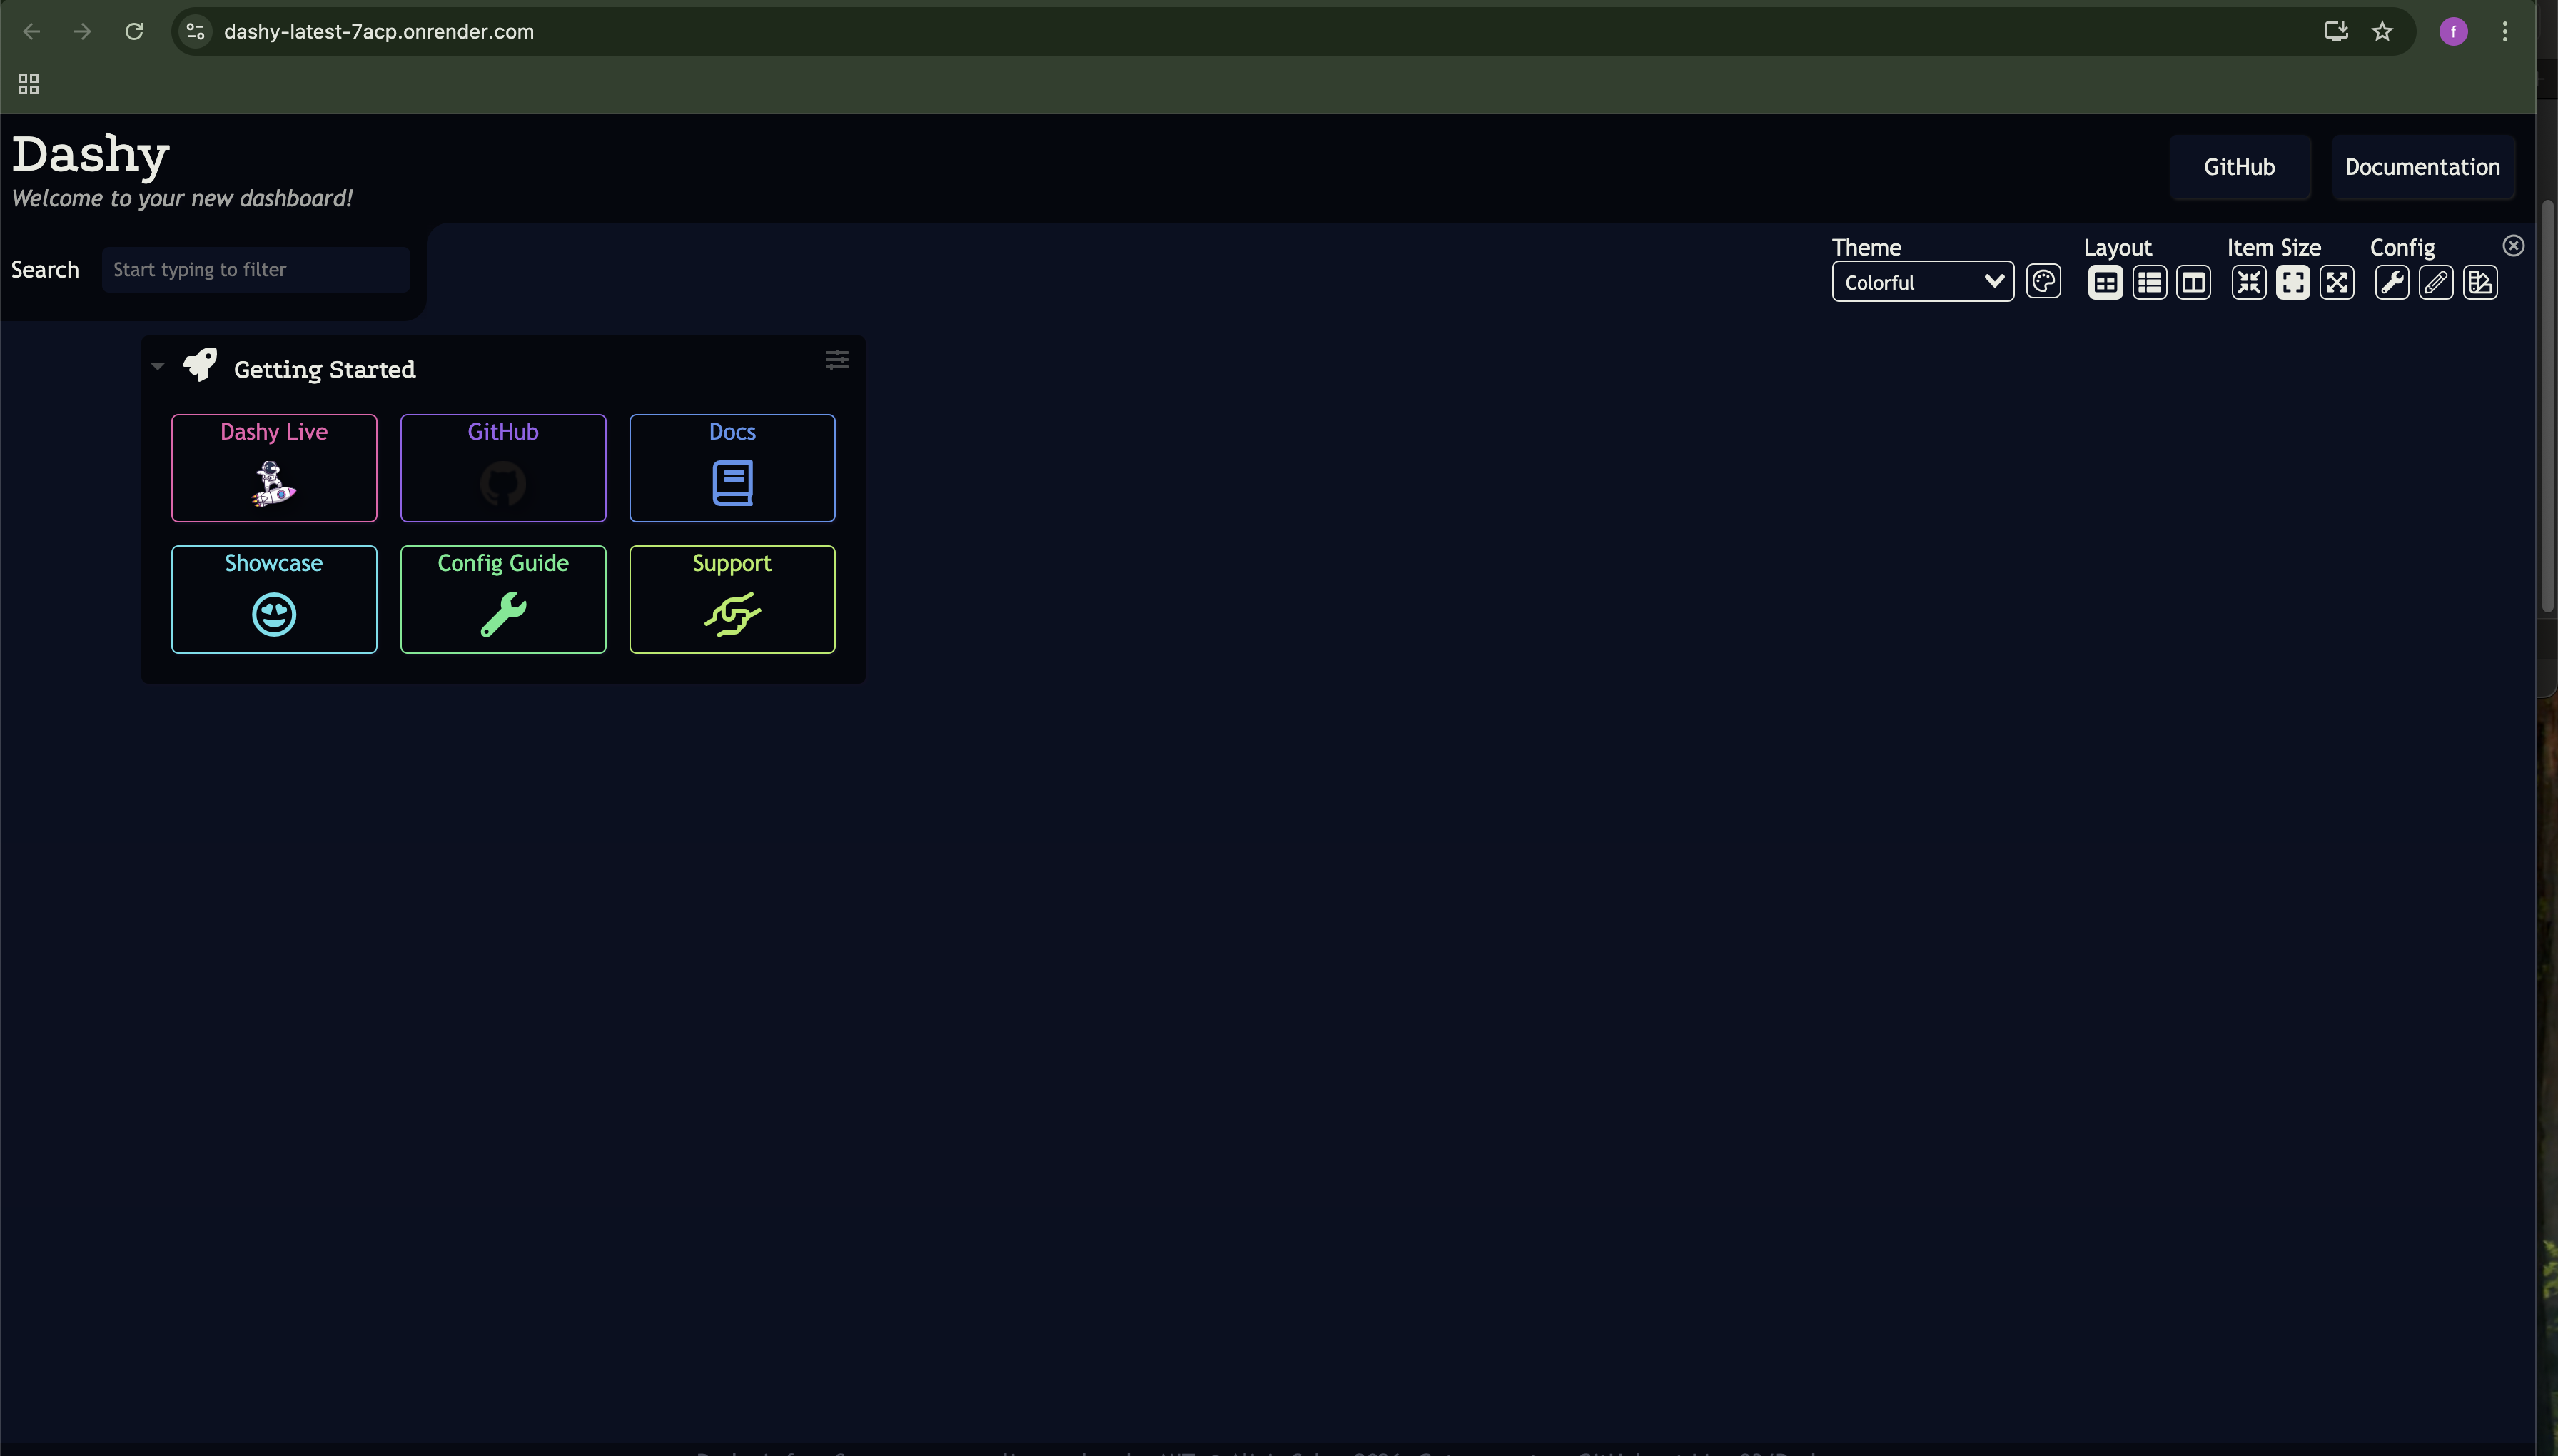
Dashy provides a single pane of glass to access all your deployed services with a beautiful, responsive interface.
🔗 Quick Links - All Services
Here's everything in one place for easy access:
🖥️ Main Application
- Backend Server: https://node-backend-prod-starter.onrender.com/
- Health Check: https://node-backend-prod-starter.onrender.com/health
📚 Documentation
- OpenAPI Spec: https://node-backend-prod-starter.onrender.com/openapi.json
- 🔐 Credentials:
admin/admin
- 🔐 Credentials:
- Scalar Interactive Docs: https://node-backend-prod-starter.onrender.com/reference
- 🔐 Credentials:
admin/admin
- 🔐 Credentials:
📊 Monitoring & Observability
- Grafana Dashboard: https://grafana-11-0-0.onrender.com/
- 🔐 Credentials:
admin/admin
- 🔐 Credentials:
- Prometheus Metrics: https://docker-4a0f.onrender.com/
- Loki Logs: https://loki-production-238c.up.railway.app/
🎯 Unified Dashboard
🚀 Getting Started
Ready to build something awesome? Let's get you set up!
Prerequisites
Make sure you have these installed:
- Node.js v22 or higher
- Docker & Docker Compose
- PNPM (recommended) or npm
Step 1: Clone the Repository
git clone https://github.com/CoderSwarup/node-backend-prod-starter.git
cd node-backend-prod-starter
Step 2: Install Dependencies
pnpm installStep 3: Environment Configuration
Copy the example environment file:
cp .env.example .envUpdate the .env file with your configuration. The template includes sensible defaults for development.
Step 4: Start Infrastructure
Start all the monitoring and database services:
pnpm run docker:upThis will start:
- PostgreSQL database
- Grafana dashboard
- Prometheus metrics collector
- Loki log aggregator
- Dashy dashboard
Step 5: Database Setup
Generate Prisma client and run migrations:
pnpm run setupStep 6: Start Development Server
pnpm run dev🎉 That's it! Your server is now running at http://localhost:8000
Try these URLs:
- Health:
http://localhost:8000/health - API Docs:
http://localhost:8000/reference - Grafana:
http://localhost:3000 - Dashy:
http://localhost:8080
📦 Project Structure Explained
Let's understand how everything is organized:
Core Foundation (src/core/)
The heart of the framework:
- BaseModule.ts - All modules extend this for lifecycle management
- BaseController.ts - HTTP request handling base class
- BaseService.ts - Business logic layer base class
- Context.ts - Shared resources (database, events)
- errors/ - Custom error types (
AppError,ValidationError) - logging/ - Winston logger configuration
- monitoring/ - Prometheus metric collectors
Modules (src/modules/)
Each business domain gets its own module:
Auth/
├── AuthModule.ts       # Module definition
├── AuthController.ts   # HTTP endpoints
├── AuthService.ts      # Business logic
└── validators/         # Zod schemas
Creating a new module? Just copy this structure!
Middlewares (src/middlewares/)
Global middlewares that run for every request:
- metrics.js - Prometheus metrics collection
- auth.js - JWT authentication
- error-handler.js - Centralized error handling
Configuration (config/)
External service configurations:
- prometheus.yml - Metrics scraping config
- loki-config.yaml - Log aggregation setup
- dashy-config.yml - Dashboard layout
🔧 Available Scripts
Here are all the commands you need:
Development
pnpm run dev              # Start with hot reload
pnpm run build            # Build for production
pnpm start                # Run production build
Database
pnpm run db:generate      # Generate Prisma client
pnpm run db:migrate       # Run migrations (dev)
pnpm run db:migrate:prod  # Run migrations (prod)
pnpm run db:studio        # Open Prisma Studio
pnpm run db:seed          # Seed database
pnpm run db:reset         # Reset database
Code Quality
pnpm run lint             # Check linting
pnpm run lint:fix         # Fix linting issues
pnpm run format:check     # Check formatting
pnpm run format:fix       # Fix formatting
pnpm run type:check       # TypeScript type check
pnpm run test             # Run tests
Docker
pnpm run docker:up        # Start infrastructure
pnpm run docker:down      # Stop infrastructure
pnpm run docker:dev:up    # Start dev environment
pnpm run docker:prod:up   # Start prod environment
Process Management (PM2)
pnpm run pm2:start        # Start with PM2
pnpm run pm2:stop         # Stop PM2 processes
pnpm run pm2:logs         # View PM2 logs
pnpm run pm2:status       # Check PM2 status
🎨 Creating Your First Module
Let's create a User module to understand the flow:
Step 1: Create Module Structure
mkdir -p src/modules/User
cd src/modules/User
Step 2: Create Module Definition
UserModule.ts:
import { BaseModule } from '../../core/BaseModule.js'
import { UserController } from './UserController.js'

export class UserModule extends BaseModule {
  constructor() {
    super({
      name: 'User',
      version: '1.0.0',
      basePath: '/api/v1/users'
    })
  }

  async initialize() {
    // Module initialization logic
    this.logger.info('User module initialized')
  }

  protected setupRoutes() {
    const controller = new UserController(this.context)

    this.router.get('/', controller.getAllUsers.bind(controller))
    this.router.get('/:id', controller.getUserById.bind(controller))
    this.router.post('/', controller.createUser.bind(controller))
  }
}
Step 3: Create Controller
UserController.ts:
import { BaseController } from '../../core/BaseController.js'
import { UserService } from './UserService.js'
import { createUserSchema } from './validators/user.validator.js'

export class UserController extends BaseController {
  private userService: UserService

  constructor(context: Context) {
    super(context)
    this.userService = new UserService(context)
  }

  async getAllUsers(req, res, next) {
    try {
      const users = await this.userService.getAllUsers()
      this.sendSuccess(res, users, 'Users fetched successfully')
    } catch (error) {
      next(error)
    }
  }

  async createUser(req, res, next) {
    try {
      // Validate with Zod
      const validatedData = createUserSchema.parse(req.body)
      const user = await this.userService.createUser(validatedData)
      this.sendSuccess(res, user, 'User created successfully', 201)
    } catch (error) {
      next(error)
    }
  }
}
Step 4: Create Service
UserService.ts:
import { BaseService } from '../../core/BaseService.js'

export class UserService extends BaseService {
  async getAllUsers() {
    return await this.db.user.findMany()
  }

  async createUser(data) {
    return await this.db.user.create({
      data
    })
  }
}
Step 5: Create Validator
validators/user.validator.ts:
import { z } from 'zod'

export const createUserSchema = z.object({
  email: z.string().email(),
  name: z.string().min(2).max(100),
  password: z.string().min(8)
})
Step 6: Register Module
In src/server.ts, register your new module:
import { UserModule } from './modules/User/UserModule.js'

async function bootstrap() {
  const app = new AppServer()

  app.registerModule(new AuthModule())
  app.registerModule(new UserModule()) // Add this line

  await app.spark(8000)
}
🎉 Done! Your User module is now live with validation, error handling, and metrics tracking!
📊 Understanding Metrics
The template automatically tracks these metrics:
HTTP Metrics
- app_http_requests_total - Total HTTP requests
- app_http_request_duration_seconds - Request duration histogram
- app_http_errors_total - Total errors by status code
System Metrics
- app_nodejs_cpu_usage_seconds - CPU usage (user/system)
- app_nodejs_memory_usage_bytes - Memory usage (heap, RSS, external)
- app_process_uptime_seconds - Process uptime
Database Metrics
- app_database_connection_pool_size - Connection pool stats
- app_database_query_duration_seconds - Query latency histogram
All metrics are automatically exposed at /metrics endpoint for Prometheus to scrape!
🔒 Security Best Practices
This template follows security best practices:
🛡️ Built-in Security Features
- Helmet - Sets 15+ security headers
- CORS - Whitelist-based origin control
- Rate Limiting - Prevents brute force attacks
- Input Validation - Zod schemas validate all inputs
- SQL Injection Protection - Prisma uses parameterized queries
- JWT Authentication - Secure token-based auth
- Password Hashing - bcrypt with salt rounds
- Environment Variables - Secrets never in code
🔐 Production Checklist
Before deploying to production:
- Change all default passwords
- Set
NODE_ENV=production - Rotate JWT secrets
- Enable HTTPS only
- Configure proper CORS origins
- Set strong rate limits
- Enable basic auth for docs
- Use environment variables for all secrets
- Enable database connection pooling
- Set up automated backups
🐳 Docker Deployment
The template includes three Docker Compose configurations:
Base Monitoring Stack
pnpm run docker:upIncludes: PostgreSQL, Grafana, Prometheus, Loki, Dashy
Development Environment
pnpm run docker:dev:upIncludes: Everything + hot-reload enabled backend
Production Environment
pnpm run docker:prod:upIncludes: Optimized builds, multi-stage Dockerfile, health checks
🧪 Testing
The template uses Node.js native test runner:
pnpm run testWriting Tests
test/user.test.ts:
import { describe, it } from 'node:test'
import assert from 'node:assert'

describe('User Service', () => {
  it('should create a user', async () => {
    const user = await userService.createUser({
      email: 'test@example.com',
      name: 'Test User'
    })

    assert.strictEqual(user.email, 'test@example.com')
  })
})
🚀 Deployment Guide
Deploying to Render
- Create a new Web Service
- Connect your GitHub repository
- Configure environment variables from
.env.example - Build command:
pnpm run build - Start command:
pnpm start
Deploying to Railway
- Create new project
- Add PostgreSQL plugin
- Connect GitHub repository
- Add environment variables
- Railway will auto-detect and deploy
Deploying with PM2
# Build the project
pnpm run build

# Start with PM2
pnpm run pm2:start

# Monitor
pnpm run pm2:status
pnpm run pm2:logs
🤝 Contributing
Contributions are welcome! Here's how:
- Fork the repository
- Create a feature branch (
git checkout -b feature/amazing-feature) - Follow conventional commits (
feat:,fix:,docs:, etc.) - Write tests for new features
- Ensure all tests pass (
pnpm run test) - Submit a pull request
📝 What's Next?
This template is continuously evolving! Here's what's planned:
- GraphQL support
- Redis caching layer
- Message queue integration (Bull/BullMQ)
- Multi-database support
- Rate limiting per user
- API versioning strategy
- Swagger UI alternative
- Health check dashboard
- Performance budgets
💡 Tips & Best Practices
Performance Tips
- Use connection pooling - Already configured in Prisma
- Enable response compression - Already enabled
- Cache frequently accessed data - Add Redis for this
- Use indexes - Add to Prisma schema
- Monitor database queries - Check Grafana dashboard
Monitoring Tips
- Set up alerts in Grafana - Get notified of issues
- Monitor error rates - Track trends over time
- Watch database connection pool - Prevent exhaustion
- Track API latency - P95 should be under 200ms
- Review logs regularly - Catch issues early
Development Tips
- Use Prisma Studio - Visual database editor
- Enable hot reload - Faster development
- Use TypeScript strict mode - Catch bugs early
- Write tests first - TDD approach
- Follow conventional commits - Better git history
📚 Resources
Documentation
Learning More
❤️ Acknowledgments
Special thanks to:
- The Node.js community for amazing tools
- Prisma team for the best ORM
- Grafana Labs for observability tools
- Everyone who contributed to this template
📄 License
This project is licensed under the MIT License - see the LICENSE file for details.
🎉 Conclusion
Building production-ready backends doesn't have to be complicated! This template gives you:
✅ Solid architecture - Modular, scalable, maintainable
✅ Security hardened - Protection against common vulnerabilities
✅ Observable - Know what's happening in real-time
✅ Well documented - Interactive API docs
✅ Developer friendly - Great DX with hot reload, TypeScript, linting
✅ Production ready - Docker, PM2, monitoring, everything you need
Whether you're building a side project, startup MVP, or enterprise application, this template has you covered. Fork it, customize it, and build something amazing! 🚀
If you find this useful, please ⭐ the repository and share it with fellow developers!
👨💻 Made with ❤️ by Code Swarup
Let's Connect!
- 🌐 Portfolio: swarupbhise.vercel.app
- 💼 GitHub: @CoderSwarup
- 📧 Email: contact.swarupbhise@gmail.com
- 🐦 Twitter: @SwarupBhise
Got questions? Found a bug? Have suggestions? Feel free to open an issue on GitHub or reach out directly!
Happy Coding! 🎨